samedi 23 mai 2020

A gap is an empty space within a price chart between the two neighboring candlesticks.

Gaps occur when the following candlestick opens at a distance from the previous candlestick closing price. This may happen if the market’s view of the price rapidly changes and there’s a sudden influx of buy/sell orders. At some point, the price which was at the closing of a candlestick is no more interesting for traders and the new price of the following candlestick better represents the value of an asset (a currency pair).

In Japanese technical analysis gaps are referred to as “windows”.

Here are the main types of gaps:

1. Breakaway gaps

Breakaway gaps occur at the end of a price pattern and signal the beginning of a new trend. Such gaps appear when the price is testing a level on the chart – support, resistance, trend line, trend channel etc. The price suddenly gaps through the tested level and then starts a new trend in the direction of the breakout. It’s easy to spot breakaway gaps on the chart. Their other advantage is that by spotting ing such gap a trader can join a new trend at the earliest stage.
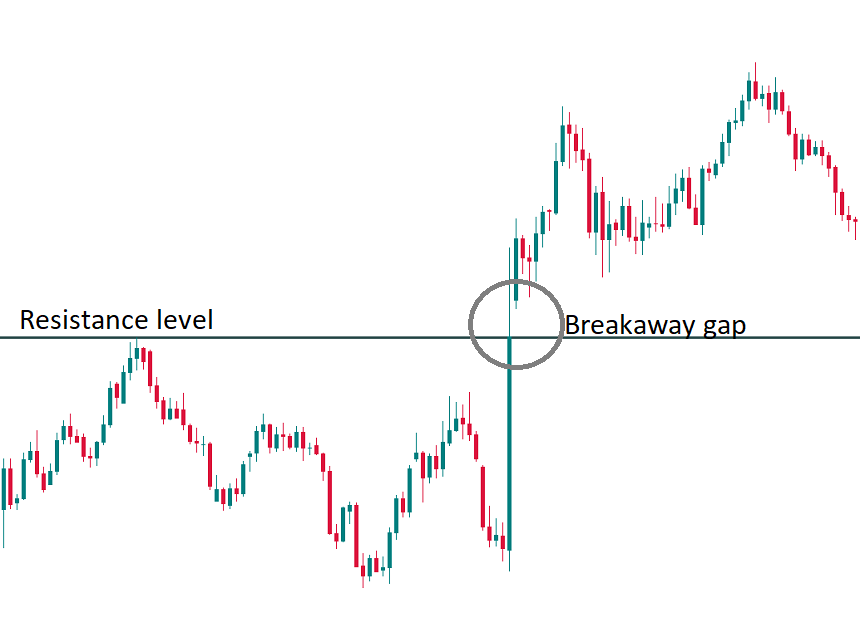
Breakaway gap chart

2. Continuation gaps

Continuation gaps happen in the middle of a price pattern and signal a rush of buyers or sellers who think that the price will continue going in the same direction. In other words, if you see a bullish gap during an uptrend, then you have a bullish continuation gap in the price chart. If a trend is bearish and a bearish gap is formed, it’s bearish continuation gap.

Continuation gap

3. Exhaustion gaps

Exhaustion gaps take place near the end of a price pattern and signal a final attempt to hit new highs or lows. During these time, the last portion of market players joins the trend and there will be no one to support this trend after that. As a result, an exhaustion gap is followed by a reversal in price action. It’s possible to take an exhaustion gap for a continuation one. To make the right distinction between these two types of gaps, have a look at the size of candlesticks: if a currency pair is very volatile, candlesticks on the chart are big and the price made several jerking moves, it might be an exhaustion gap.

Exhaustion gaps

Besides the types of gaps mentioned above, it’s also possible to see common gaps. By this term, we mean gaps that can’t be placed in a price pattern and simply represent an area where the price has gapped.

Weekend gaps

A specific type of gaps takes place after weekends. As you know, the Forex market is not very active on Saturday and Sunday, so the main currency trading ends on Friday and starts on Sunday night with the beginning of the Asia-Pacific trading session. Yet, important events may happen during the time the market is standing still. The news may include a great number of things from political announcements and interviews to natural disasters. As a result, a great number of trading orders is accumulated before the opening of the market. These orders are not met with counter orders. As there’s no demand/supply, market players have to open positions for the prices that are higher/lower than the prices seen on Friday evening. You can easily spot weekly gaps on M1-H4 timeframes. Sometimes, when there really are some big news during the weekend, an opening gap can be very wide.
Retracements

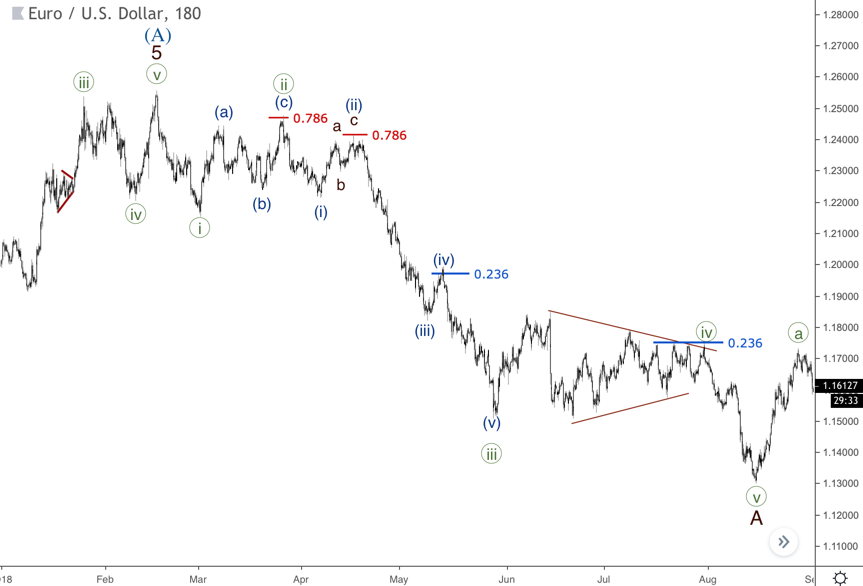
Usually, a correction tests one of the Fibonacci levels of the previous wave. The most common levels are 0.236, 0.382, 0.5, 0.618, 0.786. The last one is √0.618, which quite often turns out to be a useful level. As we already know for the previous article, there's such a thing like alternation, which means there's a special relationship between waves two and four of an impulse. One of these corrections could be sharp, and another one expresses itself in a sideways shape. At this point, we could use Fibonacci levels as a helpful tool, so let's examine some examples.
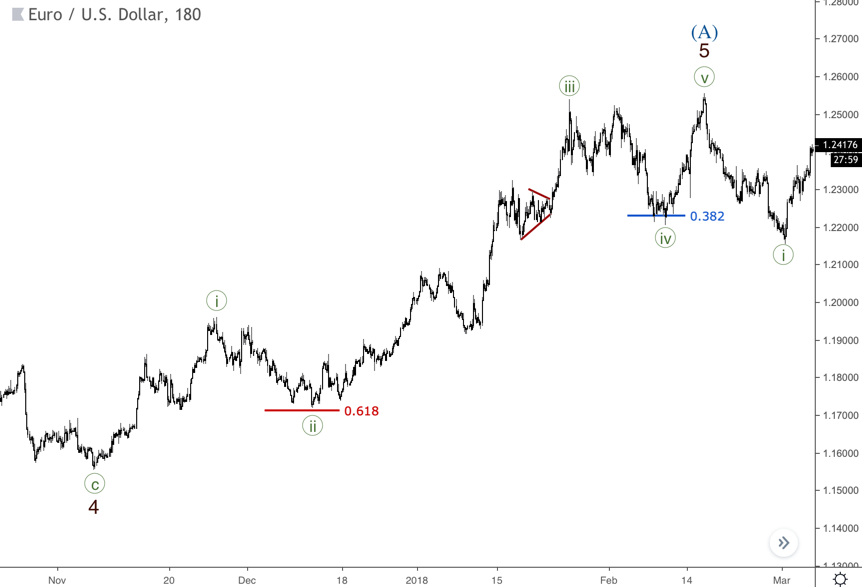
The chart below represents a classic relation between the second and fourth waves. Wave ((ii)) reached the 0.618 level while wave ((iv)) achieved just the 0.382 level of the wave ((iii)). In most cases, the second wave is deeper in relation to the preceding wave than the fourth wave. Thus, in most cases, we should watch the 0.618 level as the main target for the second wave, but there're always some exceptions and these guidelines are not written in stone.

a classic relation between the second and fourth waves

As mention above, the 0.786 level could also be a target. The next chart shows the case exactly. Wave ((ii)) and then wave (ii) finished on the 0.786 levels and both of them were a departure point for a bearish wave. At the same time, both waves (iv) and ((iv)) retraced only 0.236 of the previously formed third wave. So, that's another example of how alternation works.

Which level we should pick as a target

Even though the 0.618 level is the primary target for wave two, we should watch a structure of the correction as well. So, we should only consider wave two as ended when we have two factors on board such a finished correction structure and a pullback from one of the Fibonacci levels. This approach reduces the risks of premature opening trades and losses as consequences of that.

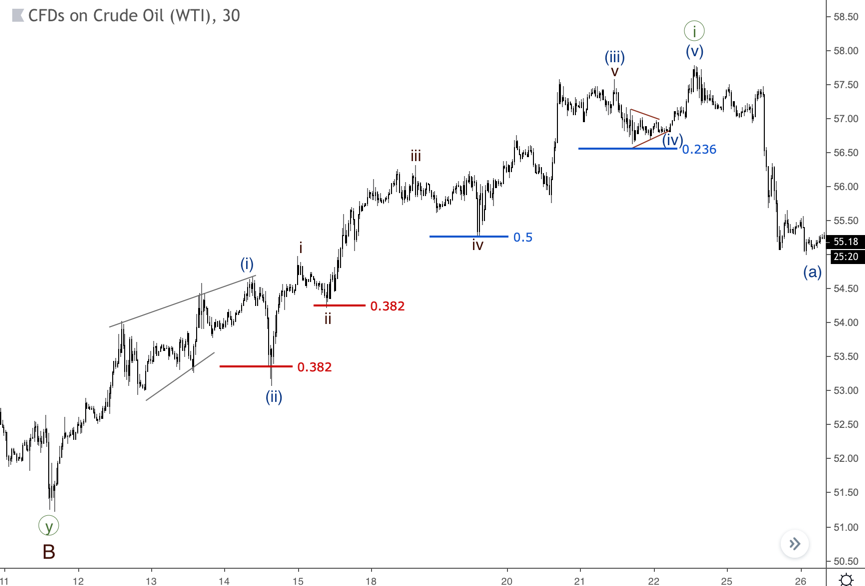
Let’s have a look at wave ((iv)), which took the form of a triangle. The ending of this pattern tested the 0.236 level, which kicked off a downward five-wave rally. This shows that we should match the ending of a triangle and the Fibonacci levels, but not the internal parts of the pattern.

wave, which took the form of a triangle

If a rally is that strong, waves two could be weak. The next chart represents this case. Both waves (ii) and ii reached just the 0.382 levels and the market continued rising. Again, it's all about the form. If we have a three-waves price movement, which we could consider as a complete correction, and then a pullback from the 0.382 level happens, then it could be enough for wave two. On the other hand, we should remember about the possibility to have a more prolonged correction as a double zigzag. Thus, whatever pattern or pullback you see, there's always no reason to forget about the risk management.

If a rally is that strong, waves two could be weak

Sometimes, wave two balances between the 0.5 and 0.618 levels. If there is a couple of pullbacks from these levels, that brings more evidence that's wave two is about to end. Also, during extension, it's common to have relatively small wave two. As you can see on the chart below, wave (ii) ended on the 0.236 level as well as wave (iv). That's more common on the stock market, where we could have rallies like a rocket quite often, so in moments like that, the price simply has no time for deeper corrections.

chart wave (ii) ended on the 0.236 level as well as wave (iv)

Fibonacci Extensions of Motive Waves (Multiples)

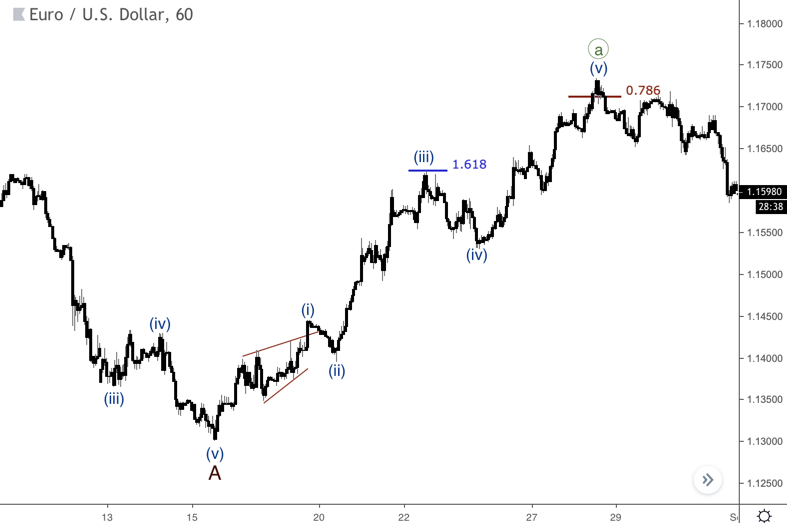
We can use the Fibonacci Extension tool to predict the length of waves three and five. The most common target to the third wave is the 1.618 multiple of the first wave. The fifth wave tends to reach the 0.618 multiple of the third wave. Such classic relations you can see on the next chart.

wave tends chart

Sometimes, an extension in the third wave turns out to be so long and in this case, we should watch 2.618, 2 and 3.618 levels as possible targets. As you can see on the chart below, wave 3 finished between the 2.618 and 3.618 levels. Again, it all depends on the wave structure. Thus, if the third wave reached the 1.618 level, but there's no finished five-wave price movement, then it'll be logical to watch the next levels as a target.

chart wave 3 finished between the 2.618 and 3.618 levels

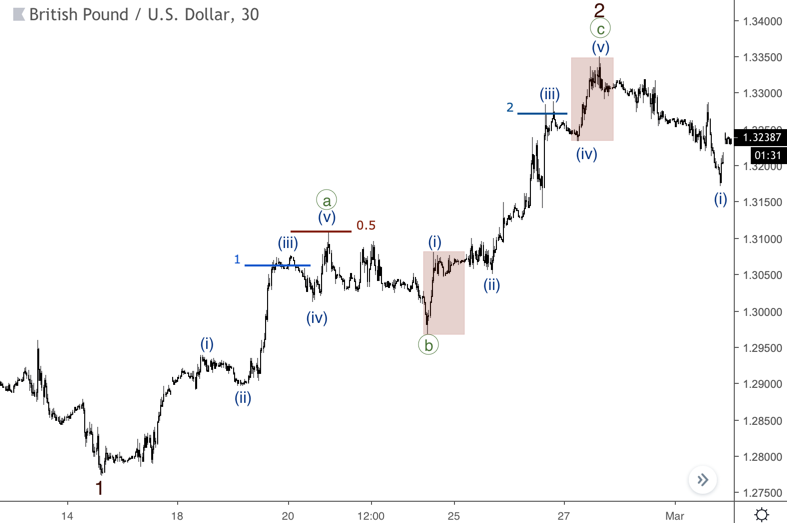
From time to time, 1 and 2 multiples are also could be useful. Wave (iii) of ((a)) on the next chart finished at 1 level, while wave (iii) of ((c)) achieved the 2 multiple levels. In both cases, the inner structure of these third waves was helpful to recognize a possible ending of these impulses.

Also, let's have a look at waves (i) and (v) of ((c)), which are equal. Usually, this happens if the third wave is more than 1.618 multiple, but again we should rely on the wave's structure first.

equal waves (i) and (v) of ((c))

The Bottom Line

 The Fibonacci relations are the core part of the Elliott Wave Principle. The structure of a developing wave could point out the appropriate Fibo level as a target, so we should always try to match the ongoing wave and the nearest level to achieve the best results.

There’re rules and guidelines in the Elliott Wave Theory. You must follow all the rules we went through in the previous articles, but the guidelines are not written in stone. In other words, guidelines not always appear but they are in a sufficient number of cases, so we shouldn’t ignore them.

What is Alternation?

Simply put, an alternation is about expecting some difference of similar waves’ expression inside a pattern by depth, complexity, and duration. Alternation happens inside impulses and corrections. Let’s see some examples.

Alternation in Impulses

Usually, there’s a relation between waves two and four in an impulse. There’s an upward impulse on the next chart. Wave (ii) of this impulse is sharp, but wave (iv) moves sideways. So, that’s how alternation works in impulses, which have two corrections inside – waves two and four. If alternation occurs, then if one correction has direction, the other one hasn’t got one.

Also, the wave (ii) is pretty easy here, but the wave (iv) has more waves inside, so there’s another alternation by complexity.

There’s an upward impulse on the next chart

The chart below shows two alternations. Inside the wave (iii) we have sharp wave ii, so, as you can guess, wave (iv) is sideways. Another example is in wave iii, its wave two moves sideways and the wave four is sharp, so the order has changed. That’s also a kind of alternation when you face such a successive changing in a shape in waves two and four.

The chart two alternations

Alternation in Triangles

Waves inside corrections subdivide into Simple, Complex and Most Complex. Inside triangles, one of the waves tends to be the most complex. As you can see on the chart below, wave B has the most complex structure while other waves are Simple or Complex.

Alternation in Triangles candlestick chart

Alternation in Zigzags

Sometimes one of zigzag’s waves has more complex structure than others. The next chart represents a case with a complex wave ((c)) in a relation to waves ((a)) and ((b)). However, if you face with a simple wave A and a complex wave B, then likely a wave C will be a simple one as well as the wave A.

a complex wave on the chart

Alternation in Double Zigzags

Waves of double zigzag could also express some difference from each other. Let’s have a look at the chart below. The wave (w) is simple, the wave (x) is complex and the wave (y) is the most complex. Thus, if we have quite easy waves W and X of a double zigzag, we shouldn’t rule out a possibility of complexness of the wave Y.

Double Zigzags chart

Alternation in Flats

The consistency ‘Simple-Complex-Most Complex’ could also apply to flats. The next chart shows a case with the most complex wave C. At the same time, wave B could be the most complex while a massive rally in wave C expresses itself as a simple wave. The chart with alternation in Flats

The Bottom Line

Alternation is one of the most useful guidelines, which helps us to understand which style of a wave we could face with in the next markets’ stages. It’s not a direct rule, but a very powerful additional tool to improve wave counts.

Triangles are a correction five-wave pattern (marked as A-B-C-D-E), which is divided into five types. This pattern is formed in a position prior to the final wave in an impulse or a correction. For example, a triangle could be formed in a wave four in an impulse or wave B in a zigzag.

Also, this pattern occurs in final wave X in a double/triple zigzag or three patterns.

  • Wave two of an impulse can’t be a triangle.
  • Waves A, B and C are usually zigzags, double zigzags, triple zigzags (that’s rare), double and triple threes.
  • Waves D and E could be triangles themselves. 

Triangle’s classification

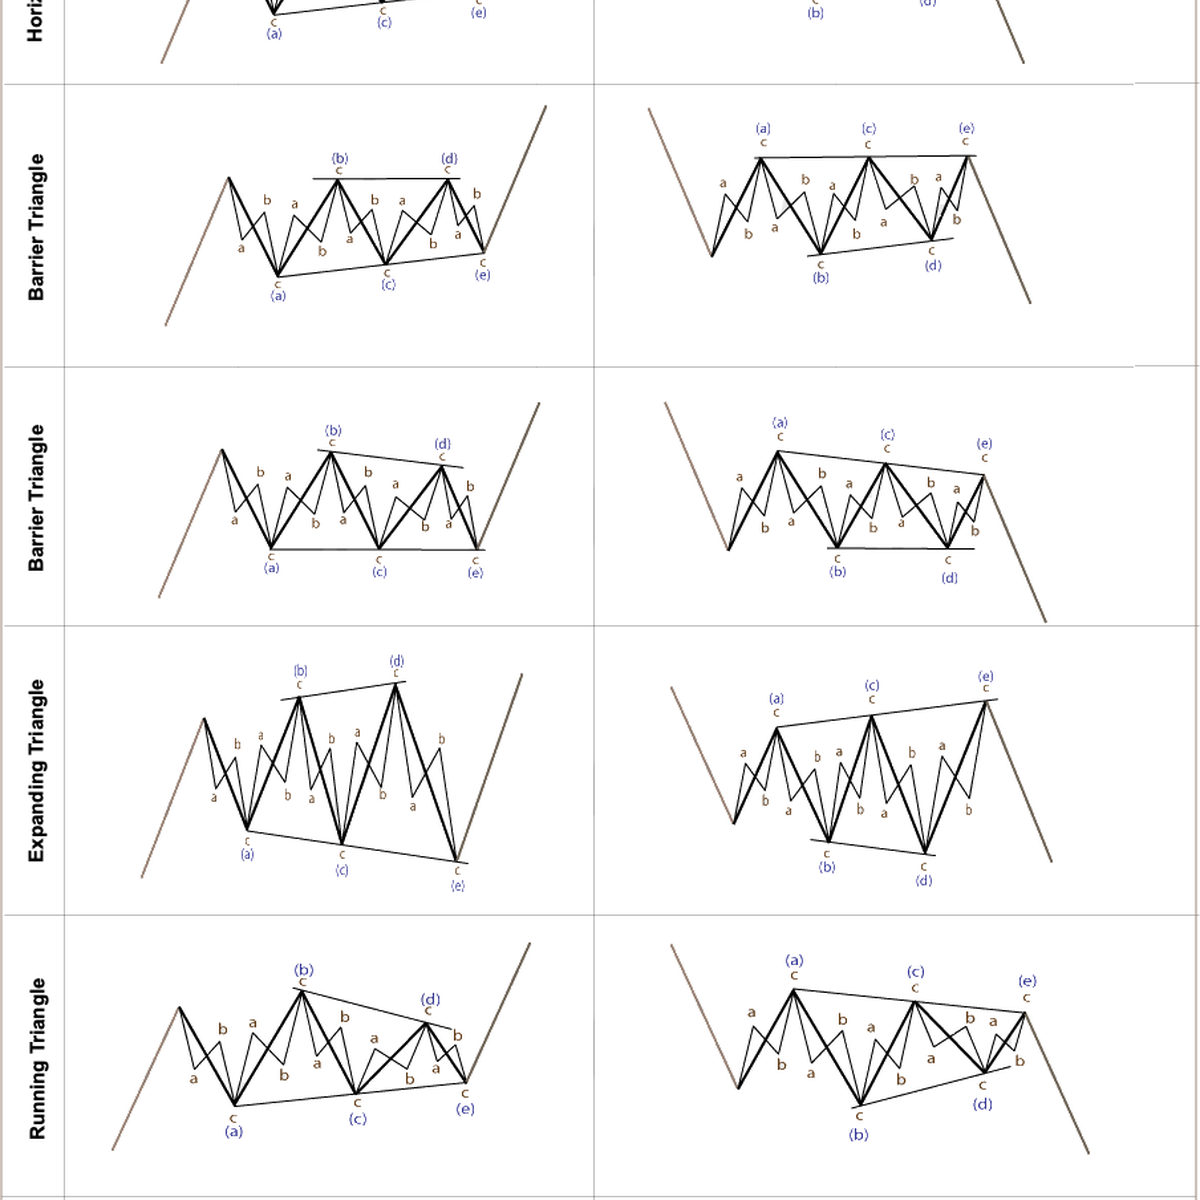
On the next picture, you can find all types of triangles (Horizontal, Barrier, Expanding, Running and Skewed). Let’s examine them one by one.

All types of triangles Elliott Wave analysis

Horizontal Triangle

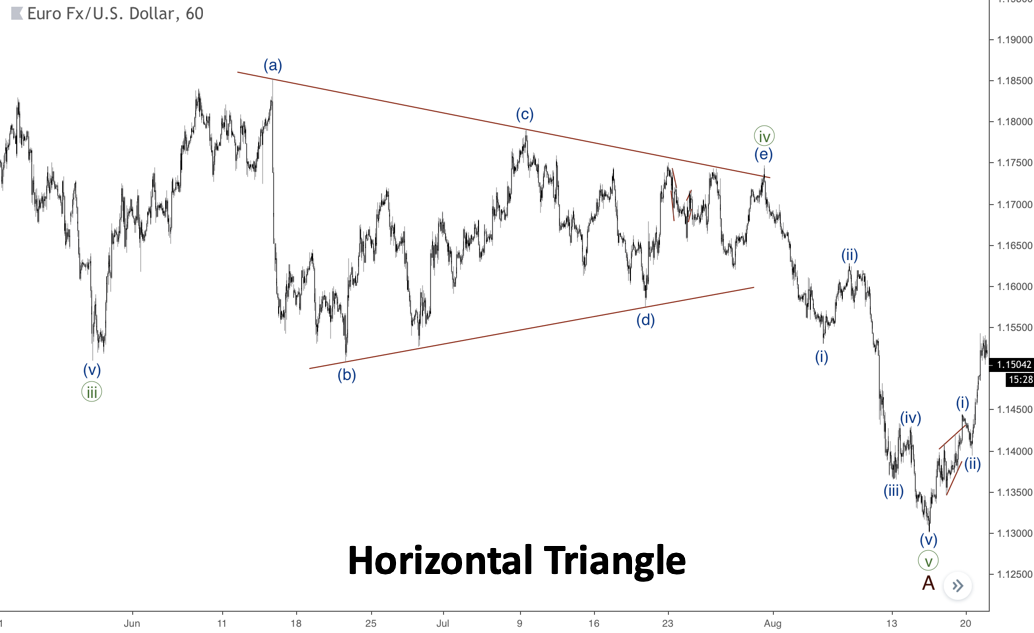
This pattern is also known as a contracting triangle. As you might guess from the name of this pattern, its lines are aimed towards each other. Each wave of this triangle is shorter than the previous one, which means wave (b) doesn’t break the beginning point of the wave (a), wave (c) doesn’t break the starting point of the wave (b) etc. On the next chart, you can see a triangle in the position of the fourth wave, so a five-wave decline happened right after the pattern.

Horizontal Triangle pattern Elliott wave

Barrier Triangle

The only difference from the contracting triangle is that the line B-D or A-C-E is horizontal. The other one goes towards a horizontal line, so a Barrier Triangle is a variation of the contracting pattern. You can find an example of this pattern on the chart below.

Barrier Triangle pattern Elliott wave

Expanding Triangle

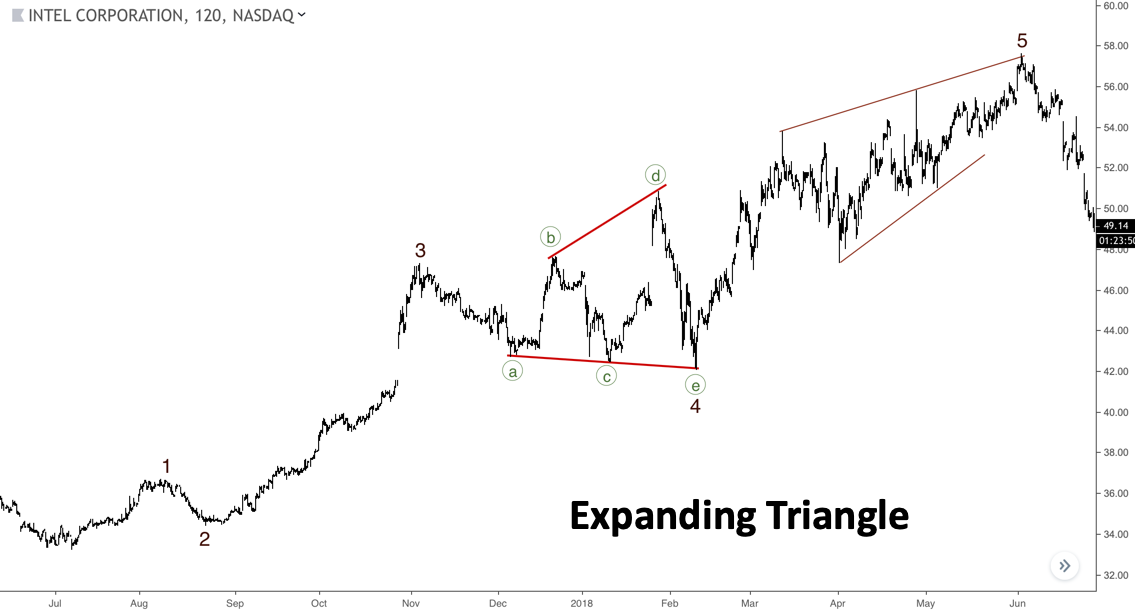
This triangle is the trickiest one. It’s simply impossible to predict this pattern from the beginning, so we could count it only when the wave E finishes. Both lines of the pattern are directed in the opposite direction.  

Expanding Triangle pattern

Running Triangle

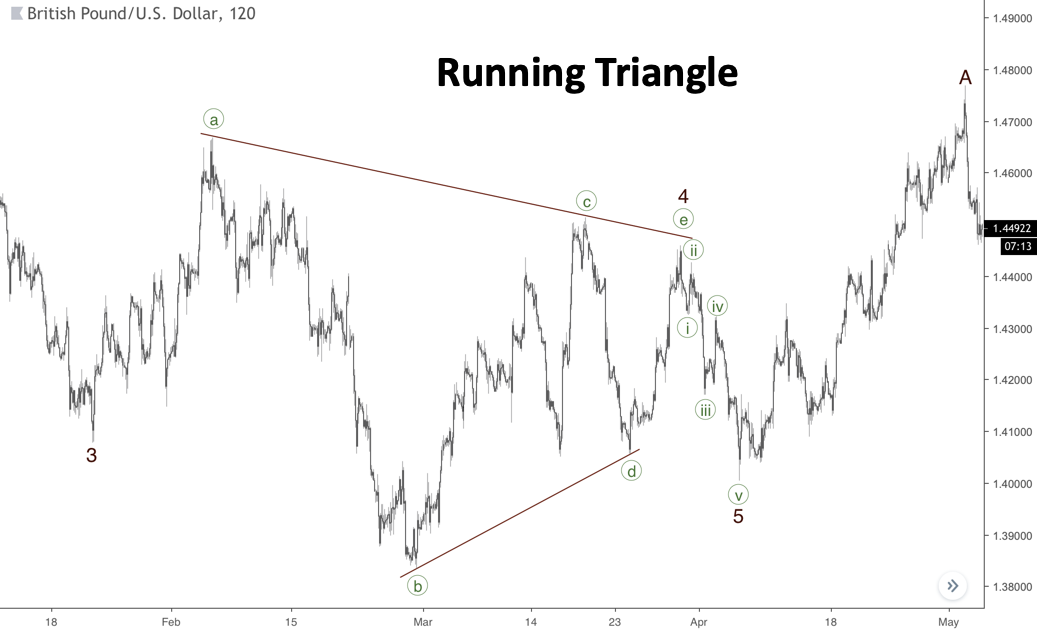
Sometimes, the wave B of a triangle could be longer than wave A, but all other waves are smaller from the one before. The next chart shows an example of a Running Triangle in the position of the fourth wave. As you can see, wave ((e)) of the pattern doesn’t reach the upper side of the triangle. This happens quite often, so we should always consider the structure of the wave E to predict its ending.

Running Triangle pattern wave theory

Skewed Triangle

If a very strong trend takes place, we could face a Skewed Triangle, its wave D is longer than wave B. So. It’s the only type of triangle, which has a direction towards the main trend. This pattern is rare and we should mark it as the last possible scenario. The following chart represents a Skewed Triangle, which pushed the price higher into the fifth wave.

Skewed Triangle pattern Elliott wave

Other examples: Ending of wave E

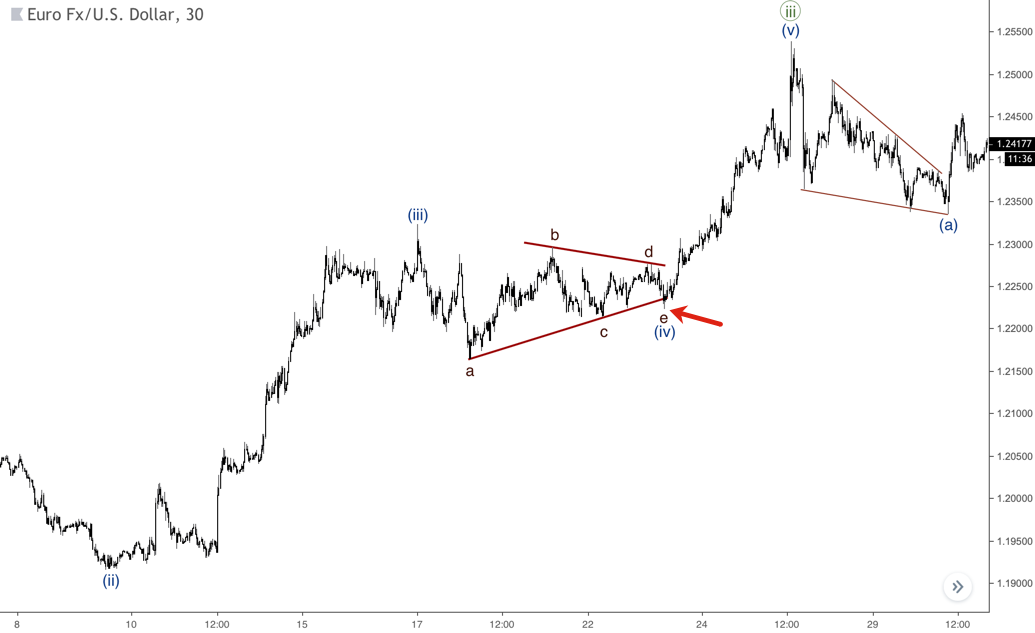
It’s possible for the wave E to break the A-C line of a triangle. If this happens, it’s important to wait for the price to come back into a range of the pattern. As you can see on the chart below, the pair tested the triangle’s lower side, but a subsequent pullback from it led to the beginning of the fifth wave.

examples Ending of wave E

Massive fifth wave

From time to time, the market could move pretty fast right after a triangle. The next chart shows that case. The ending of the wave ((iv)) as a triangle turned out to a huge rally in wave ((v)). As far as we know that a triangle forms prior to the final wave in an impulse, we should expect a correction after the rally. Note that there’s also a small triangle in wave (iv) of ((iii)).

Massive fifth wave

Two triangles

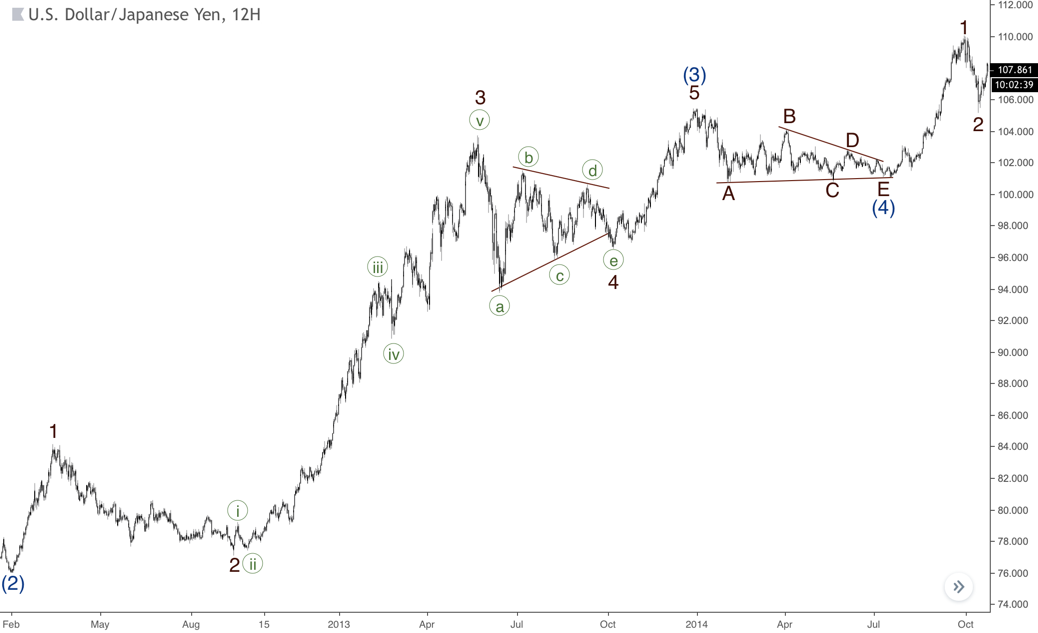
If an extension in the third wave takes place, it’s possible to wave two triangles in a row, which could be formed in a position of the fourth waves from different degrees. You can find an example of such a case on the last chart. Wave 4 of (3) is formed as a triangle, but right after the wave 5 of (3) the market developed another triangle in wave (4).

two triangles in a row

The Bottom Line

There’re a few deferent shapes of triangles. This pattern is the last correction in impulsive or corrective structures. We could count a triangle only when its structure is fully completed.

Double and Triple Threes are the trickiest wave patterns, which consist of zigzags, flats, triangles, double and triple zigzags. There’s no any rule related to order of these correction patterns, except a position of a triangle in these structures.

What’s a Double Three pattern?

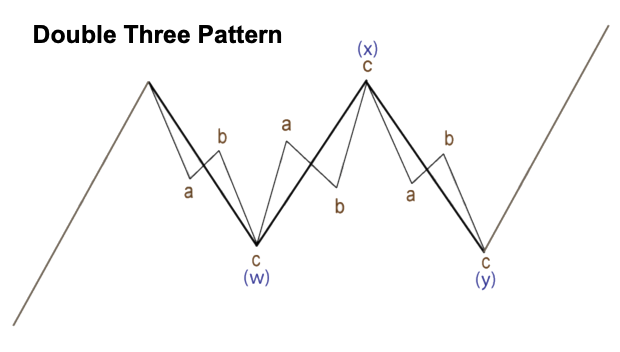
Simply put, that’s a combination of three correction patterns. Let’s have a look at an example below:

Double Three Pattern

The main rules for Double Threes trading

  • Double Three consists of three waves, which are marked as W-X-Y
  • Wave W could be any correction pattern, except triangles
  • Waves X and Y could take the form of any correction pattern
  • Double Three is formed horizontally or with a low dip against the main trend
  • In most cases, Double Threes are not deep corrections.

We could count a correction as a Double Three only when the structure is almost over. In other words, it’s not possible to predict this pattern from the very beginning of a correction. So, if a structure, which fits the Double Three’s rules arrives, only then we could decide to mark this pattern.

It’s important to understand that when we have just finished wave X, there’re always a few ways to finish the correction. We could have an impulse so that the correction could take the form of a flat. If a long zigzag is formed instead, then the correction turns out to be a double zigzag. Finally, if we have just a small zigzag, as shown in the chart above, then we could consider the possibility to have a double three pattern.

Real Examples

A Double Three pattern from zigzags is shown on the chart below. As you can see, waves (w), (x) and (y) are zigzags, so it’s the easiest shape of this pattern. Note that wave (y) is much the same as wave (w), so the correction moves almost horizontally, which is the key point in the rules for Double Threes.

A Double Three pattern from zigzags on the chart

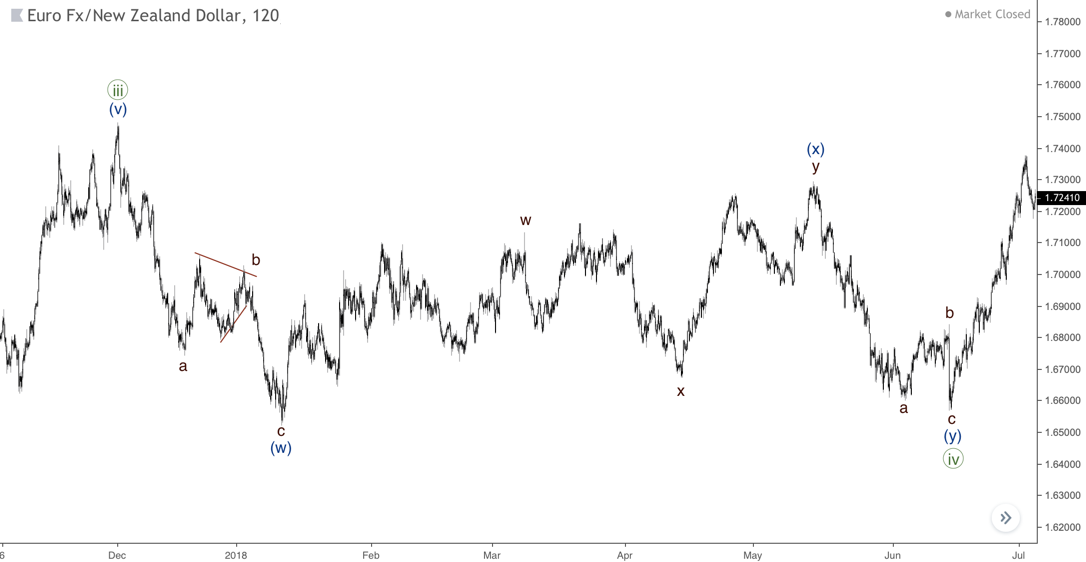
Another example is on the next chart. There’s a Double Three pattern with huge wave (x). Also, we could perfectly see the difference between a Double Three and a Double Zigzag. Wave (x) here is a Double Zigzag, so this wave has an upward direction. Wave ((iv)) has no direction, so we could mark it like a Double Three pattern as (w)-(x)-(y).

The Double Three pattern with huge wave

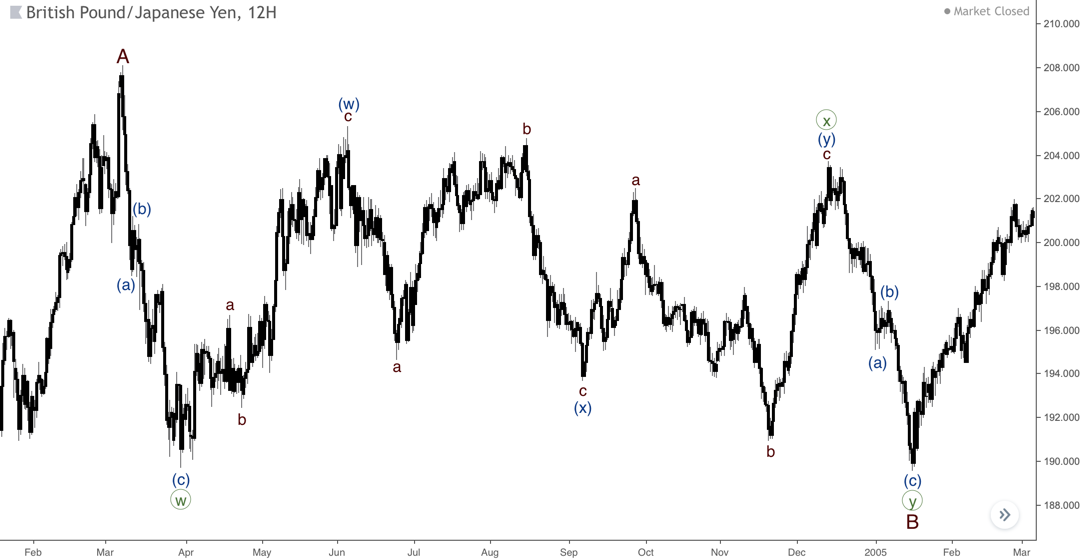
Let’s have a look at the chart below. There are two Double Threes in waves B and ((x)). Wave (y) of ((x)) is a flat pattern, which the trickiest part of the structure. Meanwhile, both Double Threes patterns have a horizontal direction (remember, that’s the guiding criterion of any Double Three).

There are two Double Threes in waves B and ((x))

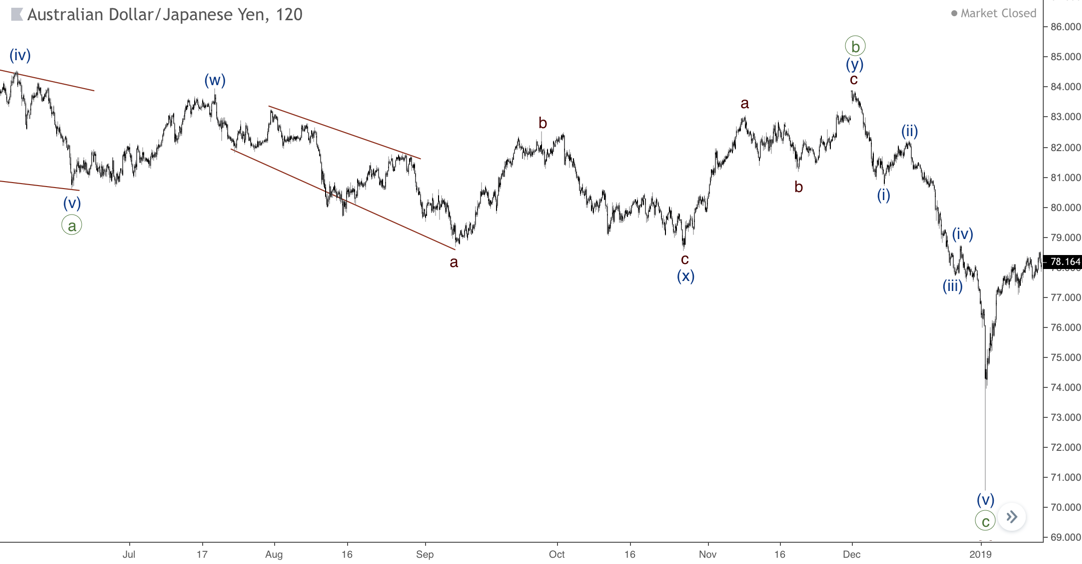
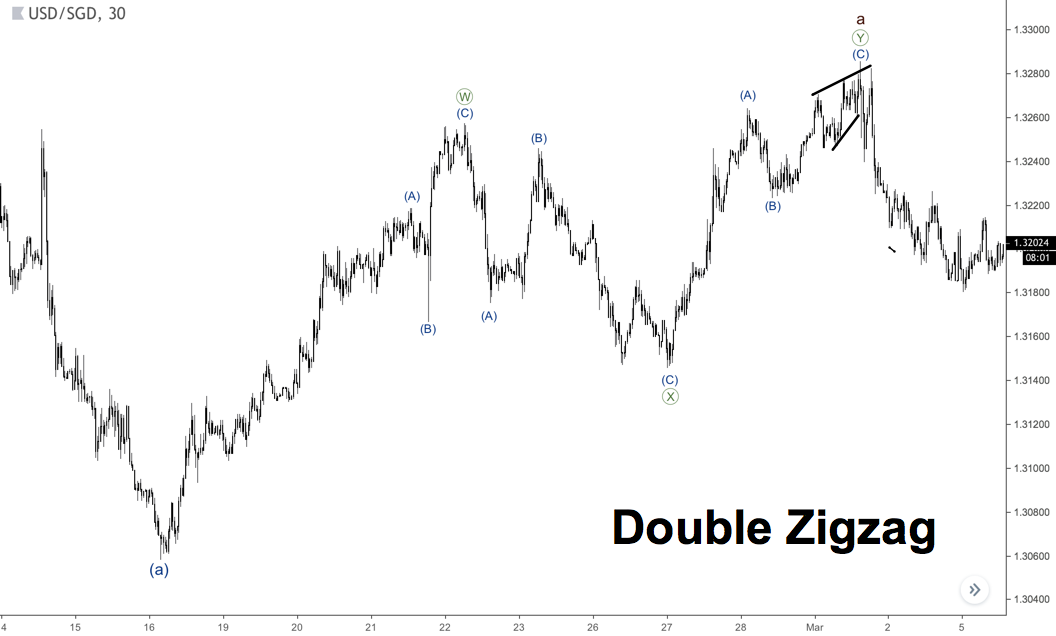
Sometimes wave X could be far longer than the wave W. As you can see on the next chart, wave (x) ended below the starting point of the wave (w), but then an upward zigzag in wave (y) has arrived. Moreover, wave (a) of (x) is a leading diagonal that makes this count even more complicated. So, in the real-time wave counting, we could make a decision on a possible ending of the wave ((b)) as a Double Zigzag only after waves (i) and (ii) of ((c)).

Australian Dollar Japanese Yen ratio chart

What’s a Triple Three pattern?

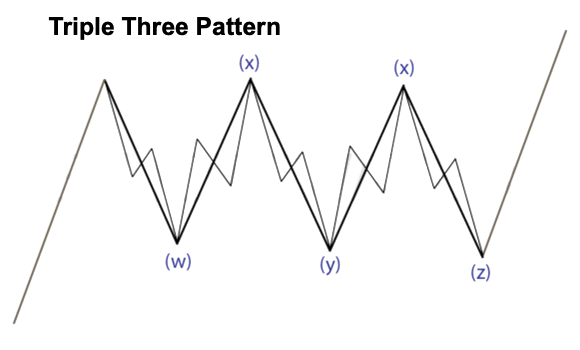
This pattern is longer than Double Three, so it subdivides into five waves, which all move sideways against the main trend.

Triple Three patter

The main rules for Double Threes trading

  • Triple Three consists of five waves, which label as W-X-Y-X-Z
  • Waves W, X, and Y could be any correction pattern, except triangles
  • Second wave X and Z could take the form of any correction pattern
  • Triple Three is formed horizontally or with a low dip against the main trend
  • In most cases, Triple Threes are not deep corrections.

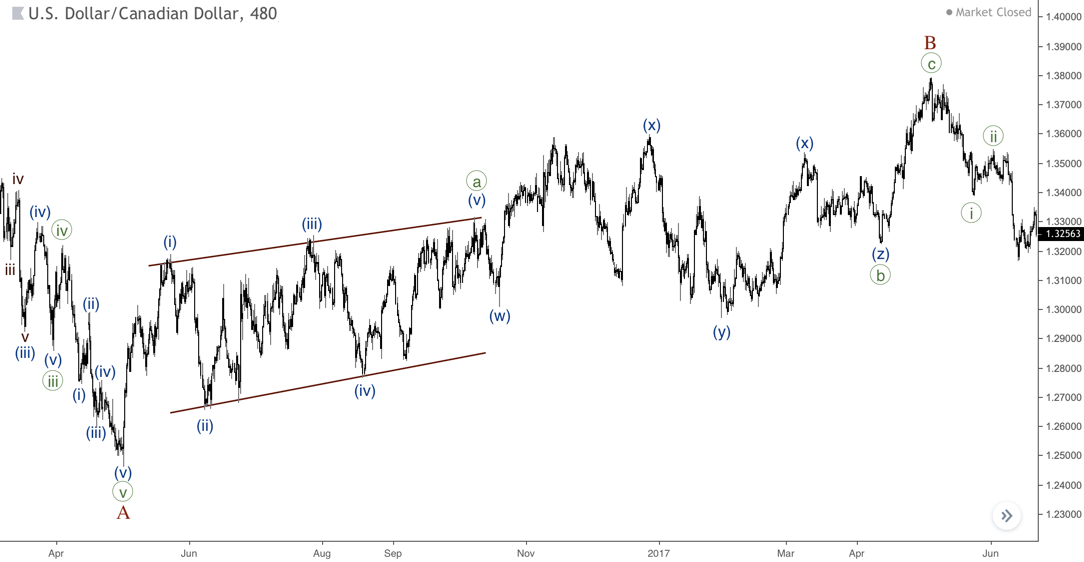
Triple Three is quite a rare pattern, so you should try to avoid counting it in real time. You can see an example of this pattern on the next chart, where wave ((b)) is a Triple Three. We could consider this structure as a Triple Zigzag only after wave (z). Actually, it works for all other correction patterns, so we should always wait until the full structure of correction arrives to make a decision on one or another wave count, which fits the rules the most.

Triple Three example on the chart

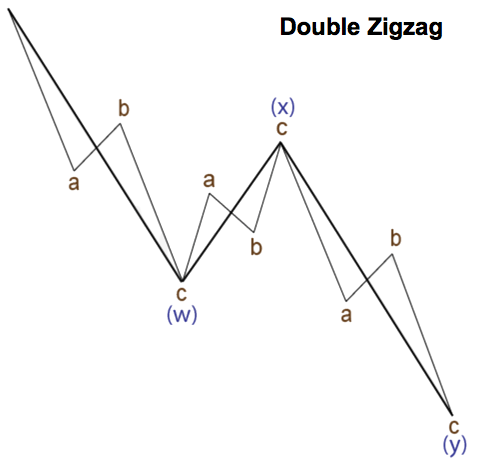
As you can guess from the title, this pattern consists of two zigzags and correction between them. This is the first complex correction pattern we’re going to examine.

Double Zigzags pattern

The main rules for Double Zigzags trading

  • Double Zigzags subdivide into three waves and labels as W, X, and Y.
  • Usually waves W and Y are zigzags.
  • Wave X could form any correction pattern.
  • Wave X is always smaller than wave W.
  • Wave Y is always longer than wave X.
  • In most cases, Double Zigzags are a deep correction in relation to the previous price movement.

It’s not easy to recognize a double zigzag in real time. Usually, this pattern forms when the first zigzag is far smaller from the expecting correction, so after a break, the second zigzag arrives. In other words, if the first zigzag isn’t enough to be a correction itself, the second zigzag takes place.

Duration of wave X

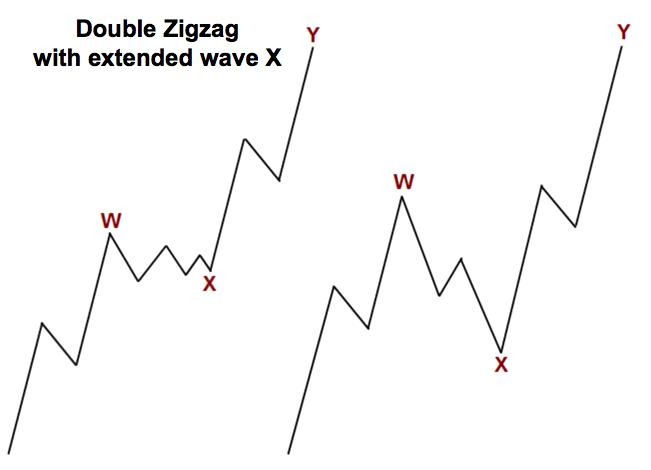
Usually, as shown in the chart below, wave X is longer than corrections inside waves W and Y. If a pattern forms in this shape, it’s pretty easy to label it. Remember, we can say that one or another pattern forms only when the whole structure ends. Until then, we should be careful.

Double zigzag with extended wave X

However, sometimes wave X of a double zigzag could be relatively small. In this case, we could count this part of a chart as a single zigzag with extended waves A or C (depending on waves relations because the third wave can’t be the shortest).

Also, if we have a possible count with the longest wave C (this example is on the right on the chart below), we should also consider an option with a developing impulse (in this case wave C turns out to be the third wave). So, it’s safer to have a double zigzag with long wave X (see the chart above), while a wave count with small wave X could also have some alternatives.

 Double zigzag patterns with small wave X

Real examples

Let’s have a look at the chart below. There’s a downward double zigzag with a triangle in wave ((x)) (we’re going to examine this pattern in the next articles). Waves (a) and (c) of waves ((w)) and ((y)) are impulses (sometimes we could face leading or ending diagonals as well). An impulse in wave (i) confirms the ending of the double zigzag.

 Double Zigzag real example

The next chart shows a double zigzag with an extended wave ((X)), so it’s easy to count two zigzags in the motive waves ((W)) and ((Y)), which both have longer waves (A). Also, note that an ending diagonal in wave (C) of ((Y)) highlights the ending of the whole pattern.

the example of double zigzag with an extended wave

Two more examples of a double zigzag are shown below. There’s a downward pattern with impulses in all motive waves. Also, there’s another double zigzag in wave (x) with a pretty rare combination of diagonals. An ending diagonal in wave ((C)) of (w) is the final wave of the first zigzag and the second one started by wave ((A)) of (y) as a leading diagonal.

Two examples of a double zigzag downward pattern with impulses in all motive waves

Triple zigzag: display and main trading rules

A pattern with three zigzags in a row calls a triple zigzag. Firstly, they're the main rules for this pattern:

  • Double Zigzags subdivide into five waves and labels as W, X, Y, XX, and Z.
  • Usually waves W, Y, and Z are zigzags.
  • Wave X could form any correction pattern, except triangles.
  • Wave XX could form any correction pattern.
  • Wave X is always smaller than wave W.
  • Wave Y is always longer than wave X.
  • Wave XX is always smaller than wave Y.
  • Wave Z is always longer than wave XX.
  • In most cases, Triple Zigzags are a deep correction in relation to the previous price movement.

As you can see, the main difference from Double Zigzags is that Triple Zigzags consist of five waves as well as impulses and diagonal. However, Triple Zigzags are corrective waves while impulses and diagonal are motive ones.

To be honest, this pattern is rare. Moreover, it’s pretty rare. In this case, we should avoid using this pattern in the real-time wave counting because in most cases we’ll be wrong sooner or later. If you think there’s a Triple Zigzag, the first thing you should do is to check if there’s another wave count possible. More often, a simpler wave count is available.

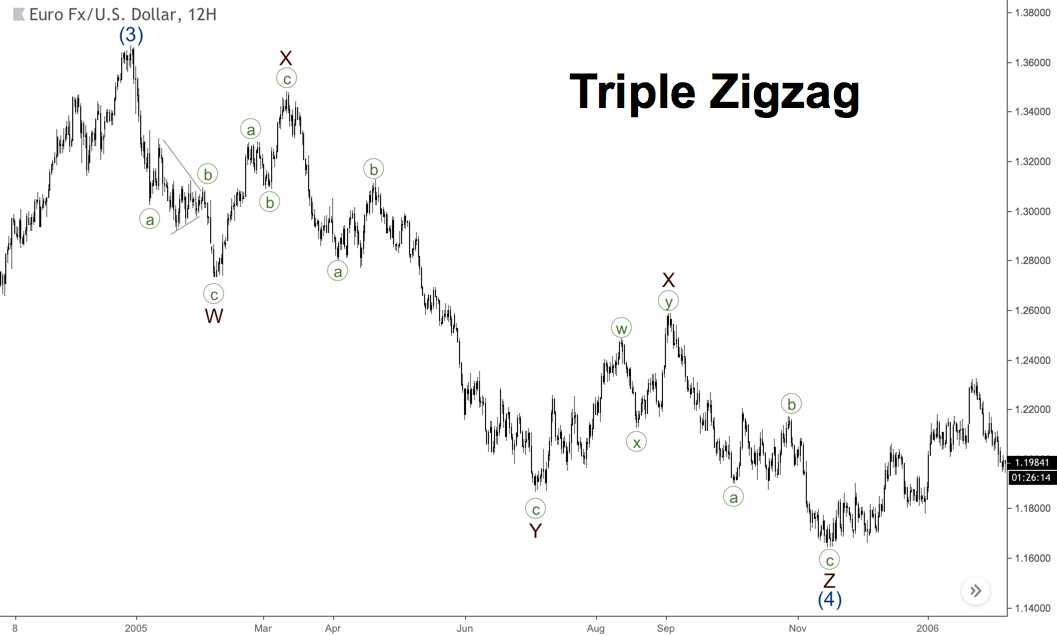
Triple zigzag pattern is rare

Real example

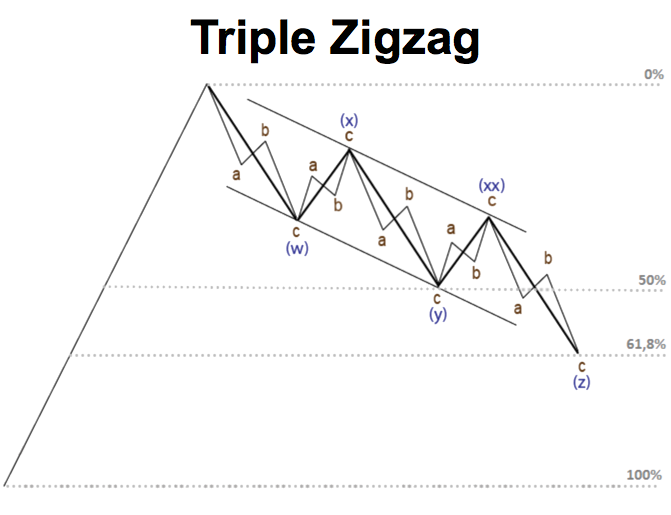
It’s pretty hard to find an example, but there’s one on the next chart. All motive waves here are zigzags. The first wave X is a zigzag and the second one is a double zigzag. Keep in mind, that the second corrective wave of a triple zigzag could be marked as X or XX.

Triple zigzag example

Unlike motive waves, corrections are more complicated and tricky structures. There're simple and complex correction patterns:

  • Zigzag
  • Flat
  • Double / Triple Zigzag
  • Double / Triple Threes
  • Triangles

The first two (a zigzag and a flat) are simple patterns, which are bricks of complex corrections. In this article, we're going to examine zigzag and flat patterns.

What's a zigzag pattern?

Like most correction patterns, zigzag subdivides into three waves, which are marked as A-B-C.

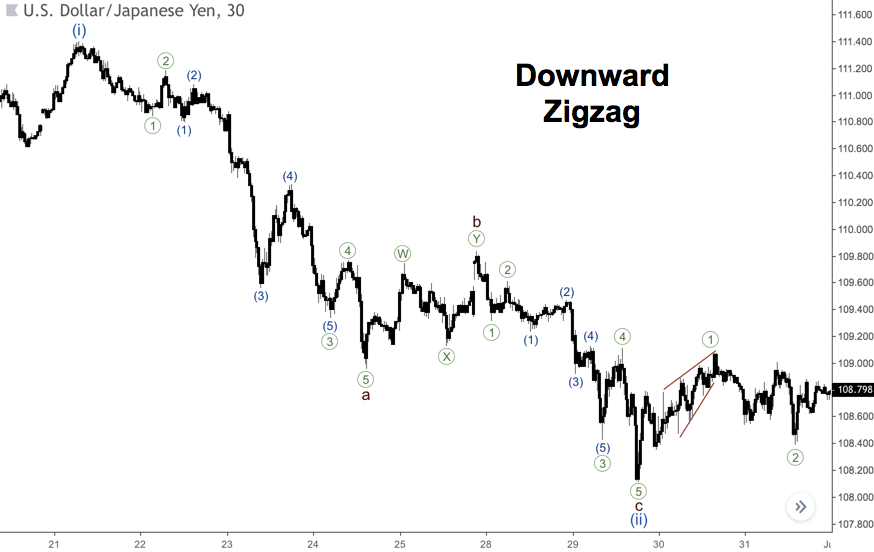
downward zigzag

The main rules for zigzags:

  • Zigzags subdivides into three waves.
  • Wave A is always an impulse or a leading diagonal.
  • Wave B could take the form of any correction pattern.
  • Wave C is always an impulse or an ending diagonal.
  • Wave B is shorter than wave A.
  • Wave C is longer than wave B.
  • Waves A and C are motive, wave B is corrective.

A flat pattern

Another simple correction is a flat pattern, it also subdivides into three waves and is marked as A-B-C, but the structure is different.

The main rules for flats:

  • Flats consist of three waves.
  • Wave A could be any correction pattern except triangles.
  • Wave B could be any correction pattern, but in most cases, it's a zigzag.
  • Wave C is always an impulse or an ending diagonal.
  • Wave B has a length of more than 90% of wave A.
  • Wave C is usually equal or even longer than wave B.
  • Waves A and C are motive, wave B is corrective.

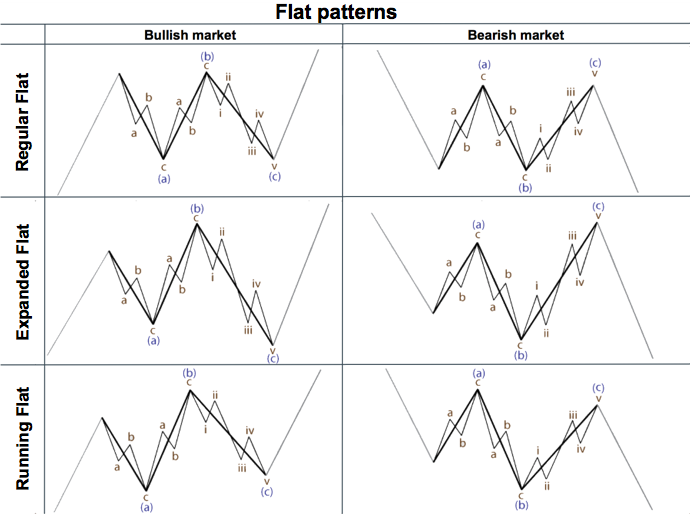
As you can see from the chart below, there’re three types of the flat pattern depending on the length of waves B and C.

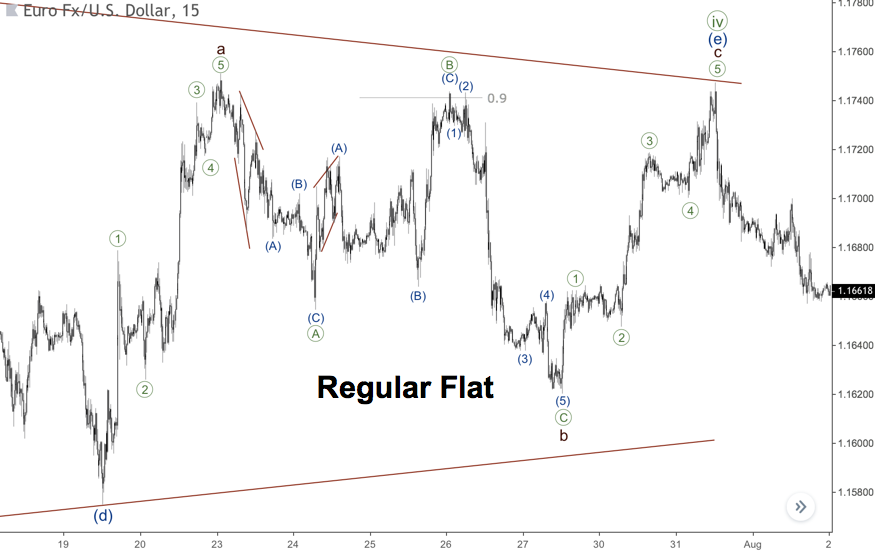
Regular Flat: Wave B is almost equal to wave A (at least 90%), while wave C tends to be equal to wave B.

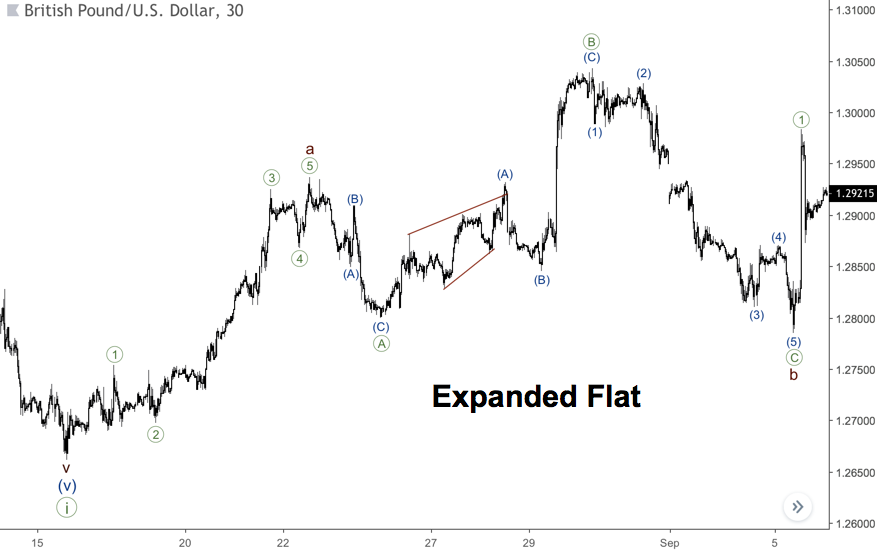
Expanded Flat: Wave B is longer than wave A and wave C is longer than wave B.

Running Flat: Wave B is longer than wave A, but wave C is shorter than wave B.

Flat trading patterns

Real examples

The chart shows a simple zigzag in wave (ii) with impulses in waves a and c. This is the most common structure of zigzags. Also, pay attention to a leading diagonal, which has formed after wave (ii). The pattern confirmed the ending of the zigzag.

 the most common structure of zigzag pattern

Elliott wave patterns form on all markets, including cryptocurrencies. There’s Ethereum chart below, where we could find three zigzags. The biggest one is wave (ii). As you can see, the wave (a) of (ii) is a leading diagonal pattern. Wave ii (on the right) is a zigzag with the same structure (wave ((A)) is a leading diagonal). Another zigzag is wave b (in the middle of the chart), its wave ((A)) is far longer than wave ((C)). Sometimes such a disproportion happens, so now you know what you can face with.

Upward Zigzag with a Leading Diagonal in wave

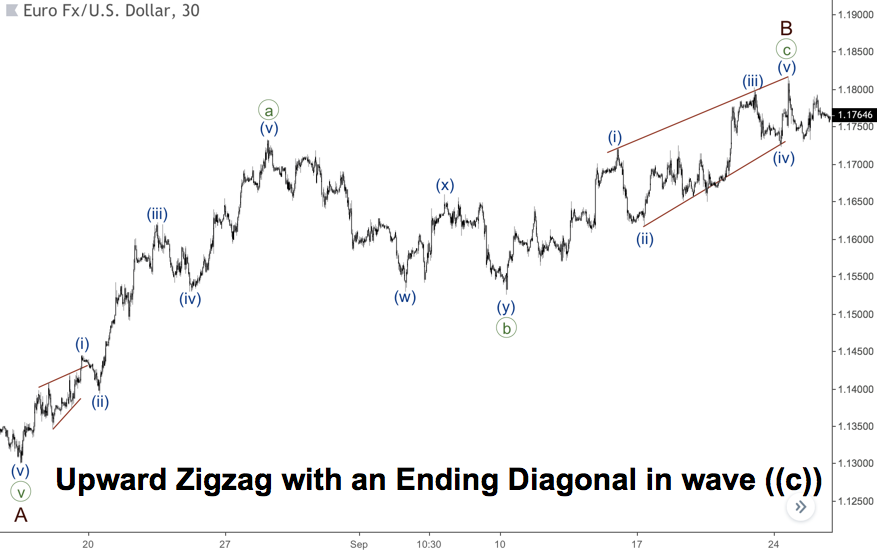
It’s also possible to have a zigzag with an ending diagonal in wave C, you can see this case on the next chart. Wave ((a)) here is an impulse, but after wave ((b)) there’s an ending diagonal in wave ((c)). As you already know, an ending diagonal could form in a position of the last wave of a motive wave (wave five of an impulse or wave C of a zigzag).

a zigzag with an ending diagonal

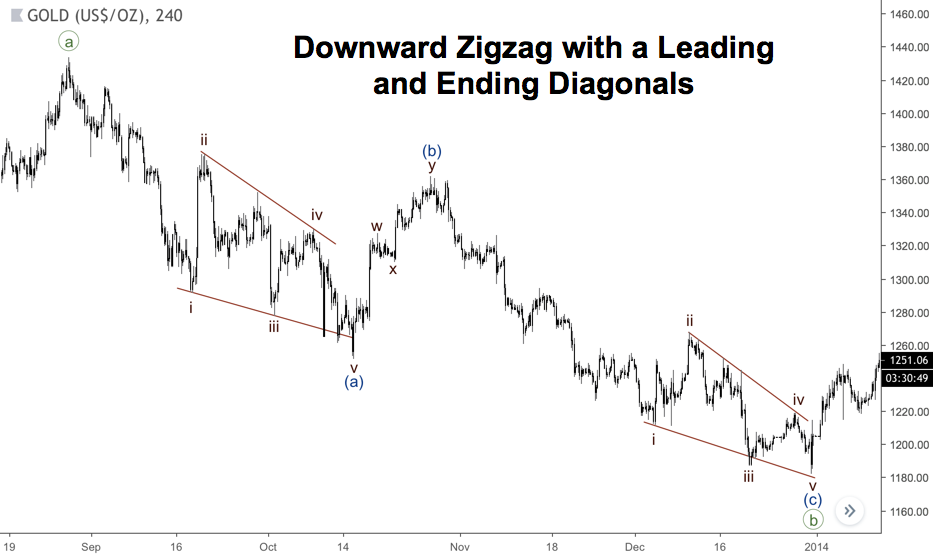
The chart below represents such a rare case when motive waves of a zigzag are formed like a leading and ending diagonals. Contracting diagonals are more common, but we also could face a structure with expanding ones.

a zigzag chart

Sometimes wave C of a zigzag could be fast-moving as you can see on the next chart. There’s a plain and clear structure of the wave (a), but wave (c) consists of only three bars. This usually happens when news or political events influence the price movement.

a fast-moving zigzag

There’s a flat pattern in wave b on the chart below. This is a regular flat because wave ((B)) is about 0.9 of wave’s ((A)) length. However, the wave ((C)) is pretty fast. There’s one more interesting thing. There’re two zigzags in waves ((A)) and ((B)). The first pattern has wave (A) as an expanding leading diagonal, which is quite rare. The next zigzag has a contracting leading diagonal in wave (A) of ((B)), which is more common.

a flat pattern in wave b on the chart

Wave C of a flat pattern could be also an ending diagonal as shown on the next chart. Wave (b) is shorter than wave (a), so it’s a regular flat. However, an ending diagonal in wave (c) finishes below the high of wave (a) that is how running flats ends. As you can see, there’re some variations in each type of flat patterns in the real market.

a flat pattern an ending diagonal

The last chart shows a perfect example of an expanded flat pattern. Wave ((B)) is far longer than wave ((A)) and the ending of wave ((C)) breaks the low of wave ((B)). The subsequent bullish impulse in wave ((1)) confirms that a flat pattern is over.

an expanded flat pattern


Follow US on Facebook

Popular Posts