


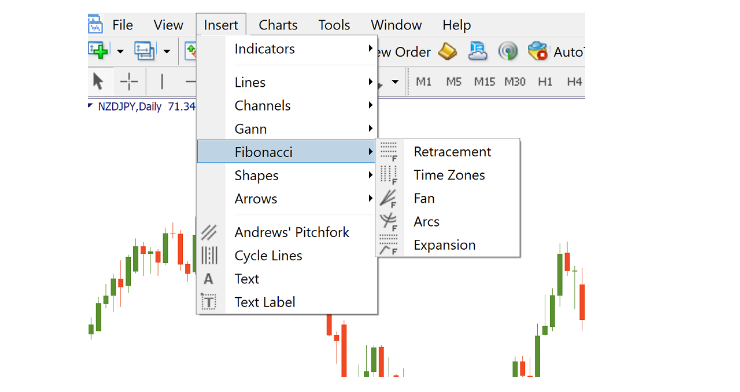
Fibonacci tools are constantly used by Forex traders. To apply them to your charts in MetaTrader, you need to click “Insert” button of the menu and then choose “Fibonacci”. You can find several Fibonacci tools in your trading terminal: retracement, expansion, fan, arcs and time zones. All of these tools are based on Fibo ratios.
Let’s study the logic behind the Fibonacci instruments.
In the 13th century, mathematician Leonardo Fibonacci researched a series of numbers (0, 1, 1, 2, 3, 5, 8, 13, 21, 34, 55, 89, 144, etc.). Every number in this sequence is the sum of the two preceding ones. It turned out that the ratios of these numbers correspond to the natural proportions of the things in the universe. For example, tree branches form or split in line with Fibo numbers, seed pods on a pinecone are arranged in a Fibonacci spiral pattern, etc.
Financial markets are no exception: different movements of the market are often consistent with Fibonacci ratios as well.
Fibonacci sequence has some constant ratios. The most important Fibo ratios are:
- 161.8%, the “golden ratio” (the ratio between any number of the sequence and the preceding one, ex.: 89/55 = 1.618).
- 61.8% (the ratio between any number of the sequence and the following one, ex.: 55/89 = 0.618).
- 38.2% (the ratio derived from skipping 1 sequence in division e.g. 55/144 = 0.382).
Among the Fibonacci tools, we have mentioned the most useful for traders are Fibo retracement levels and Fibo expansions, but fan, arcs and time zones and also be quite helpful.


0 commentaires:
Enregistrer un commentaire